Eingelegte Lebensmittel - Seite 3
Nährwertangaben
Durchschnittliche Nährwertzusammensetzung für 1225 Produkte der Kategorie Eingelegte Lebensmittel, deren Nährwertinformationen bekannt sind (aus insgesamt 1390 Produkten).
| Nährwertangaben | So wie verkauft für 100 g / 100 ml |
Standardabweichung | Minimum | 10. Quantil | Median | 90. Quantil | Maximum |
|---|---|---|---|---|---|---|---|
| Energie |
386 kj (92 kcal) |
287 kj (69 kcal) |
0 kj (0 kcal) |
99 kj (23 kcal) |
230 kj (55 kcal) |
909 kj (217 kcal) |
3.400 kj (828 kcal) |
| Fett | 6,98 g | 8,28 g | 0 g | 0,1 g | 0,5 g | 21,6 g | 92 g |
| Gesättigte Fettsäuren | 1,09 g | 1,26 g | 0 g | 0,01 g | 0,1 g | 3,3 g | 17 g |
| Kohlenhydrate | 4,39 g | 3,38 g | 0 g | 0,1 g | 3,9 g | 10,8 g | 83 g |
| Zucker | 3,15 g | 3,36 g | 0 g | 0 g | 1,4 g | 9,5 g | 72 g |
| Ballaststoffe | 1,87 g | 1,28 g | 0 g | 0 g | 1,7 g | 4 g | 25,7 g |
| Eiweiß | 1,15 g | 0,584 g | 0 g | 0,5 g | 1 g | 2,3 g | 17 g |
| Salz | 2,24 g | 1,17 g | 0 g | 0,9 g | 1,9 g | 4,4 g | 44,2 g |
| Alkohol | 0 % vol | 0 % vol | 0 % vol | 0 % vol | 0 % vol | 0 % vol | 1,4 % vol |
Land: Deutschland - Entsprechende Produkte aus der ganzen Welt anzeigen
1.392 Produkte
-
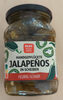
Jalapenos Gemuese in Scheiben - Rewe beste Wahl - 330g
-
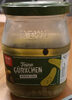
Aceitunas verdes con especias - Sol&Mar - 105 g

-
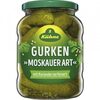
Gurken Moskauer Art - Kühne - 670g
-
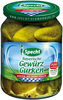
Bayerische Gewürzgurken - Specht - 360g
-
Ravioli Herz - Lidl - 250g

-
Griechische grüne Oliven - Delphi - 0pcs

-
Sandwich Gurken - Kühne - 185g

-
670g
-
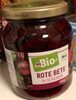
Rote Beete - Rewe Bio - 220g

-
Kräuter Oliven - Feinkost Dittmann - 170.0 g
-
Bayerische Gewürzgurken - Specht - 185g
-
Gurkensticks - King's Crown - 520g
-
Rote Beete - BioBio - 500g
-
Spanische Oliven, gefüllt mit Paprikapaste - Matithor - 330 g

-
Griechische Oliven mit Knoblauch - Lyttos - 200g
-
Gewürzgurken - Bautz'ner - 360 g
-
Greek Olives - GAEA - 150g
-
Burger Gurken - Kühne - 150g

-
Spanische Oliven, geschwärzt - dumet - 150g

-
Grüne Oliven - Rewe
-
Gurken Senfgurken - Spreewaldhof - 420g
-
Cornichons mit Kräutern - REWE Beste Wahl - 370 g, 190 g
-
Grüne Oliven - Tomate - Fürstenkrone - 100g

-
ATJAR TJAMPOER - Conimex - 235g
-
Cornichons MINIS saveur estragon - Auchan - 0.66 kg

-
Gurken Spreelinge - Spreewaldhof - 300g
-
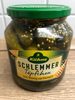
Gurken Sauer Honig Schlemmertöpfchen - Kühne - 530g
-
Klostergarten Delikatess Gurkenfäßchen - 670 g

-
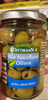
Olivenmix mit Kräutern - Rewe Bio/Optima Feinkost - 180 g

-
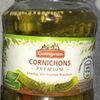
Cornichons premium - Klostergarten - 350g
-
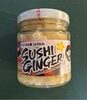
Sushi Ginger - MIYAKO JAPAN - 190g
-
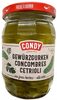
Gewürzgurken - condy - 540g
-
Grüne Oliven mit Stein in Lake - Alnatura - 310 g

-
Rote Bete - Franken - 500g

-
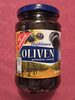
Grüne Oliven - ja! - 320 g
-
Kapern-Äpfel - Beste Ernte - 290 g
-
Oliven schwarz - Neri - 135 g
-
Gewürzgurken - Beste Ernte - 670g
-
Ponti Peperlizia Insalata Per Riso GR350 - 350 g
-
Apfel-Rotkohl - Kühne - 350 g
-
Kalamata Oliven al naturale - Mani - 1pcs
-
Olives vertes dénoyautées - U Bio - 37 cl, 160 g
-
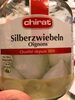
Silberzwiebeln - Chirat - 1pcs
-
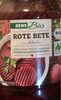
Rote Bete - REWE Bio - 330 g, Abtropfgewicht 220 g
-
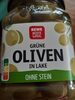
Grüne Oliven in Lake - REWE - 135g
-
Gewürzgurken - Edeka mein Bayern - 670g

-
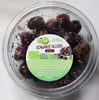
Schwarze Bio-Oliven, mariniert - Gut Bio - 100 g
-
Gewürzgurken, scharf-würzig - Hengstenberg - 670g

-
Senfgurken - Bautz'ner - 420g
-
Gurken Cornichons - Naturaplan - 300g
-
Knoblauch Toskanische Art mit Kräutern in Öl - Rewe - 190 g
-
Dänischer Gurkensalat - Kühne - 185g
-
Glas Rote-Beete-Kugeln - Klostergarten - 220g

-
Ingwer eingelegt - VitAsia - 190g
-
Gurken Sticks - Klostergarten - 670 g, 360 g Abtropfgewicht
-
Rote Beete - Kugeln, Glas - REWE Beste Wahl - 330g
-
Rote Bete - Bonduelle - 265 g
-
Oliven schwarz - Coop - 150g

-
Oliven Bio Nocellara - Dittmann - 95g
-
Feine Gürkchen - REWE Beste Wahl - 1pcs
-
Cornichons würzig Knackig - K-Classic - 670g
-
cornichons extra fin - Leader Price - 360g

-
Sandwichgurken - American - 360g
-
Spanische Oliven - Migros - 150g
-
Oliven Hojiblanca - geschwärzt, entsteint - Gut gunstig - 160 g
-
Sommarskörd - Ikea - 370 g (240 g égoutté)
-
Olives bio de kalamata entieres - GAEA - 150g
-
Geschwärzte Oliven - REWE - 160 g

-
Gurken - Brotzeit - REWE - 290g

-
Cornichons Essiggurken - Migros Bio - 380g

-
Olives vertes dénoyautées au piment - Sol & Mar - 105 g

-
Silberzwiebeln - CONDY - 315g

-
Gurkenhappen Schlesischer Art - Kühne - 670g

-
Manzanilla Oliven - REWE Beste Wahl - 130g
-
REWE Beste Wahl Antipasti Grüne Oliven ohne Stein in Lake - 135 g (290 g)

-
Cornichons - Beste Ernte - 370g
-
Spreewälder Gewürzgurken - Spreewald Königin - 360 g

-
Grüne Oliven gefüllt mit Mandeln - REWE - 280 g

-
Apple fruit crisps - Klostergarten - 670g

-
Rote Bete - dm Bio - 220g
-
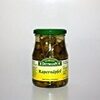
Kapernäpfel, eingelegt - Feinkost Dittmann - 350g
-
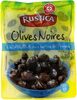
Olives noires à la grecque aux herbes de Provence - Rustica - 150 g
-
Schweizer Gewürzgurken - CONDY - 1000g

-
Mixed Pickles Glas - Kühne - 330g

-
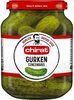
chirat Gurken - 400g
-
Oliven geschwärzt, entsteint - K-Classic - 330 g / 160 g Abtropfgewicht

-
Kapern - condy - 65g

-
Griechische Oliven Mit Mandeln - Lyttos - 200 g

-
Cornichons suisses - Hugo Reitzel - 200g

-
Sandwichgurken - K-Classic - 530 g
-
Gurken Gewürzgurken - süß sauer - Penny - 360g
-
Gewürzgurken ungesüßt - Alnatura - 670 g
-
Gurkentopf - Kaufland - 1pcs

-
Gurkentopf - Alpenschmaus - 850g

-
Silberzwiebeln - GUT&GÜNSTIG - 190g
-
Gewürzgurken Auslese - Bio - Edeka Bio - 360 g

-
Unser Schätzchen - Cornichons - Spreewaldhof - 530 g
-
Sandwich Gurken - Mike Mitchells - Glas 670g

-
Peperoni - Alnatura - 350 g
-
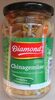
Chinagemüse - Diamond - 175g